Online dashboards
Every retailer's sell-out and stock, in one view.
Sell-out and stock from every retailer you supply, cleaned and joined to your own product and store lists, in online Power BI dashboards. See what is selling, where, and how it compares with last year, and spot the stock gaps before they cost you a sale.
Sell-out
What sold, where, and against last year.
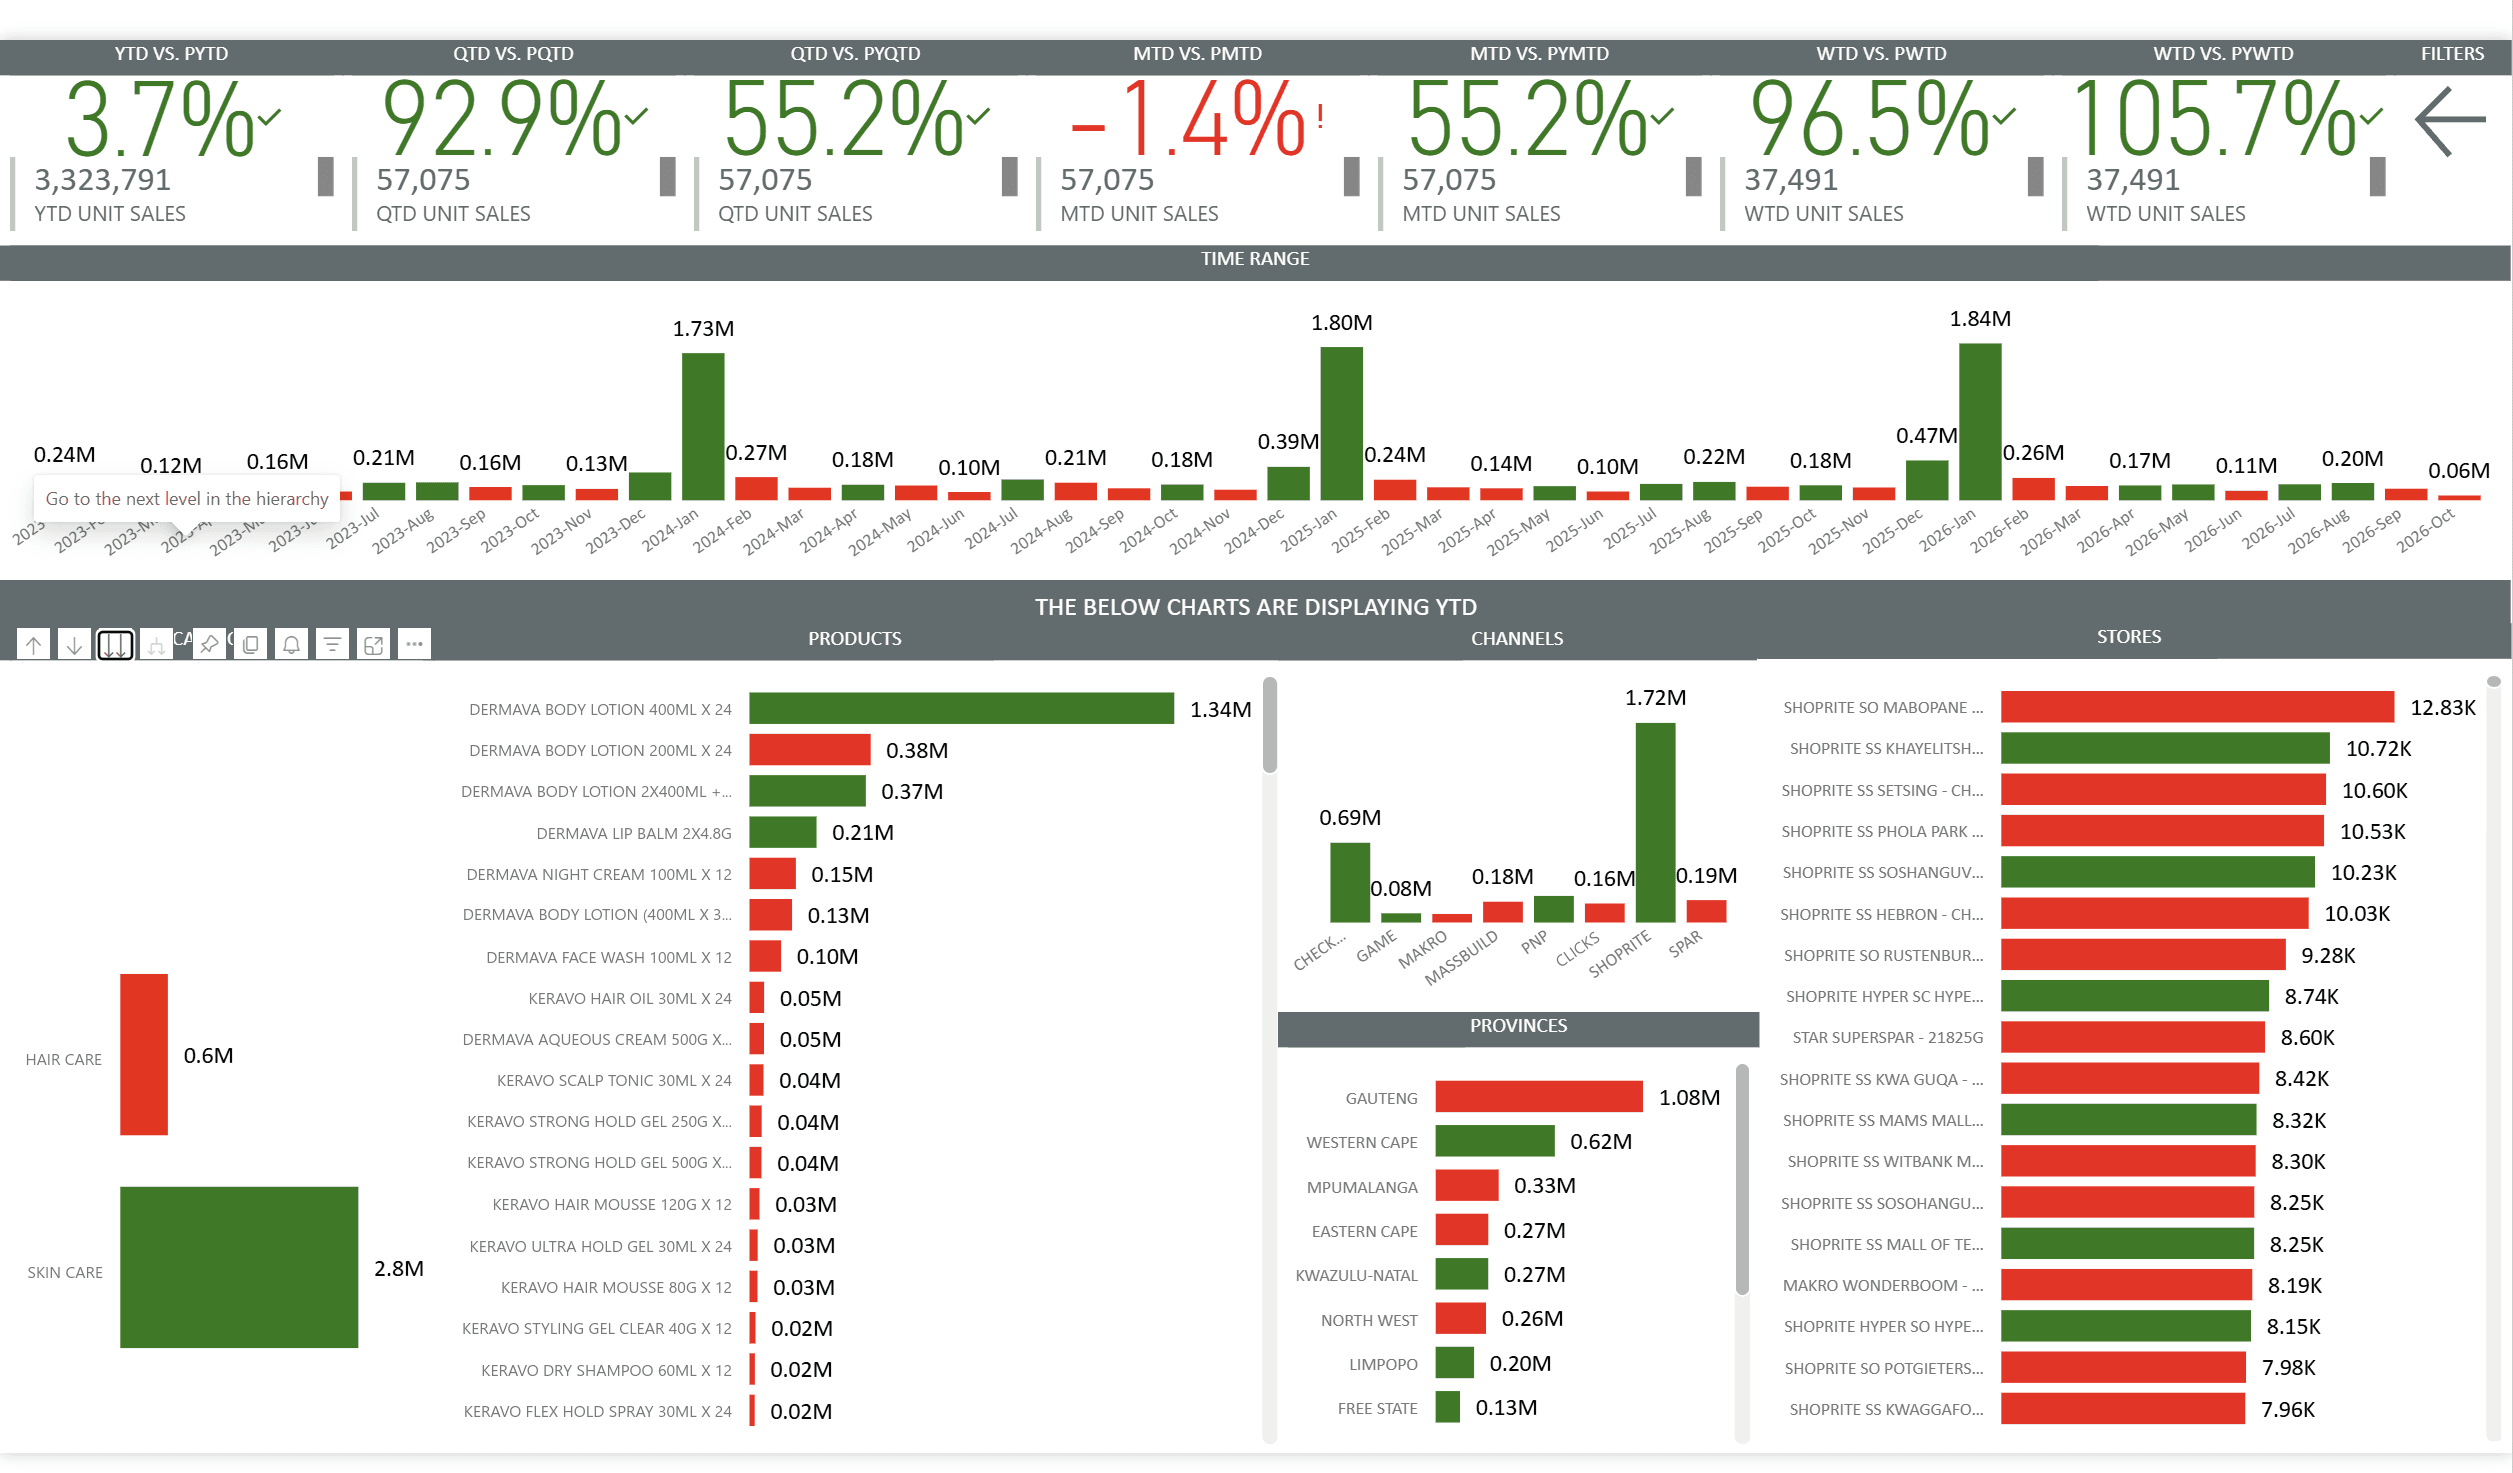
The first page a supplier opens: how the year, quarter, month and week are tracking, then the products, retailers, regions and stores behind it.
Point at a number to see what it shows.
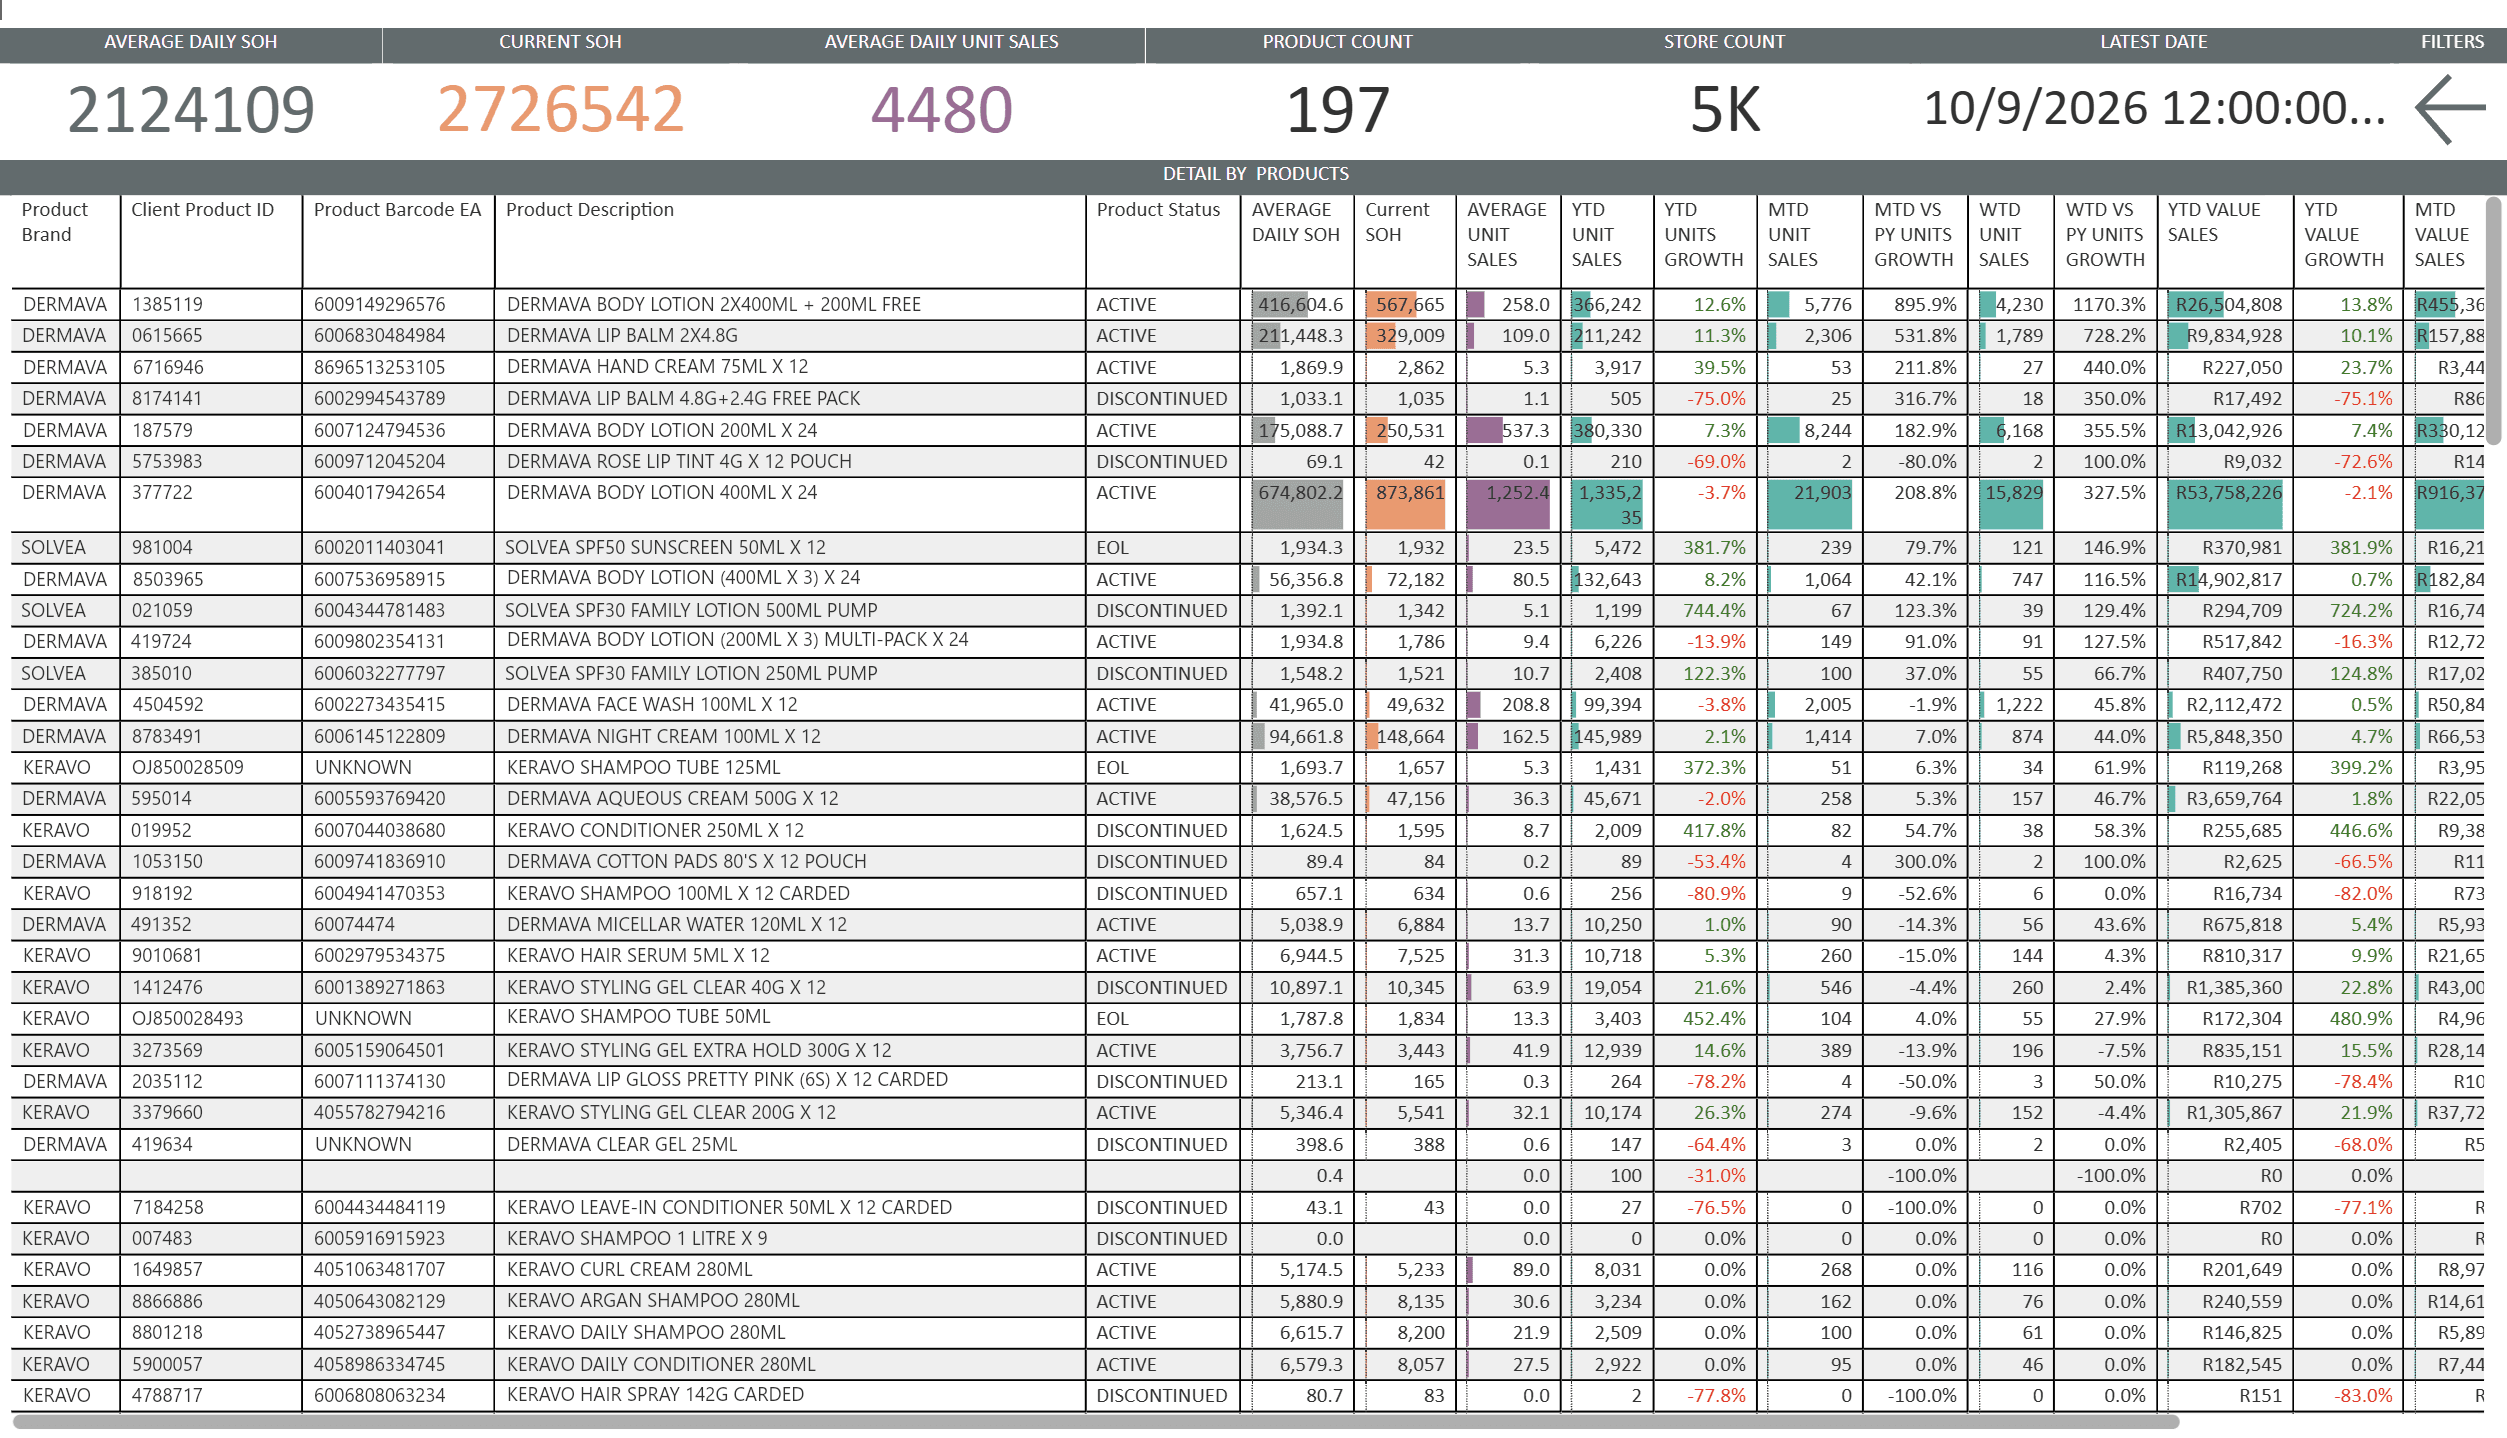
One row per product with its stock, rate of sale and growth, so you can see at a glance which lines are carrying the business.
Point at a number to see what it shows.
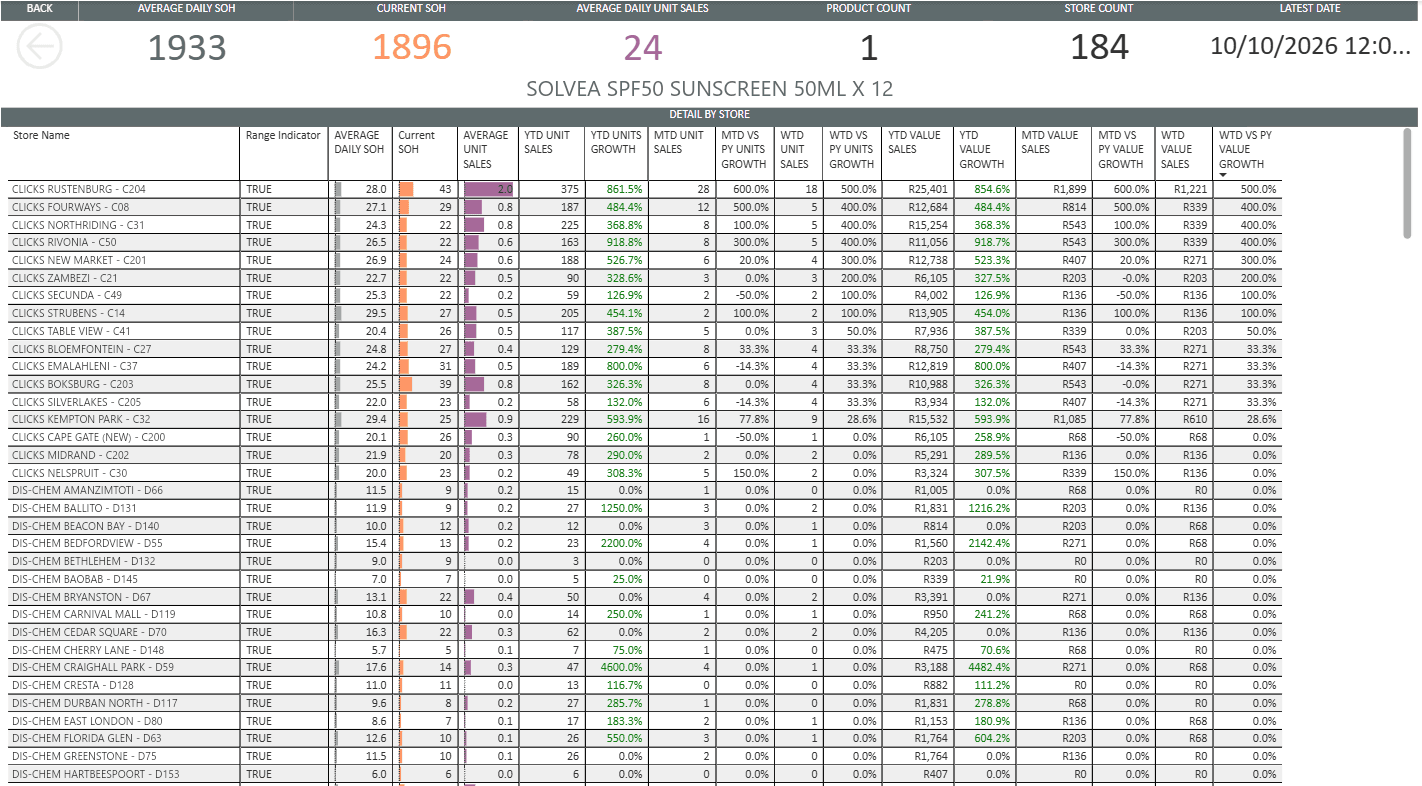
What you see after right-clicking a product in the table above and choosing Drill through, Store view: that one line in every store that stocks it, with stock, rate of sale and growth side by side. Find the stores dragging it down and send the field team there first.
Point at a number to see what it shows.
Stock health
Know where stock is short, and where it is stuck. Stock on hand joined to what is actually selling.
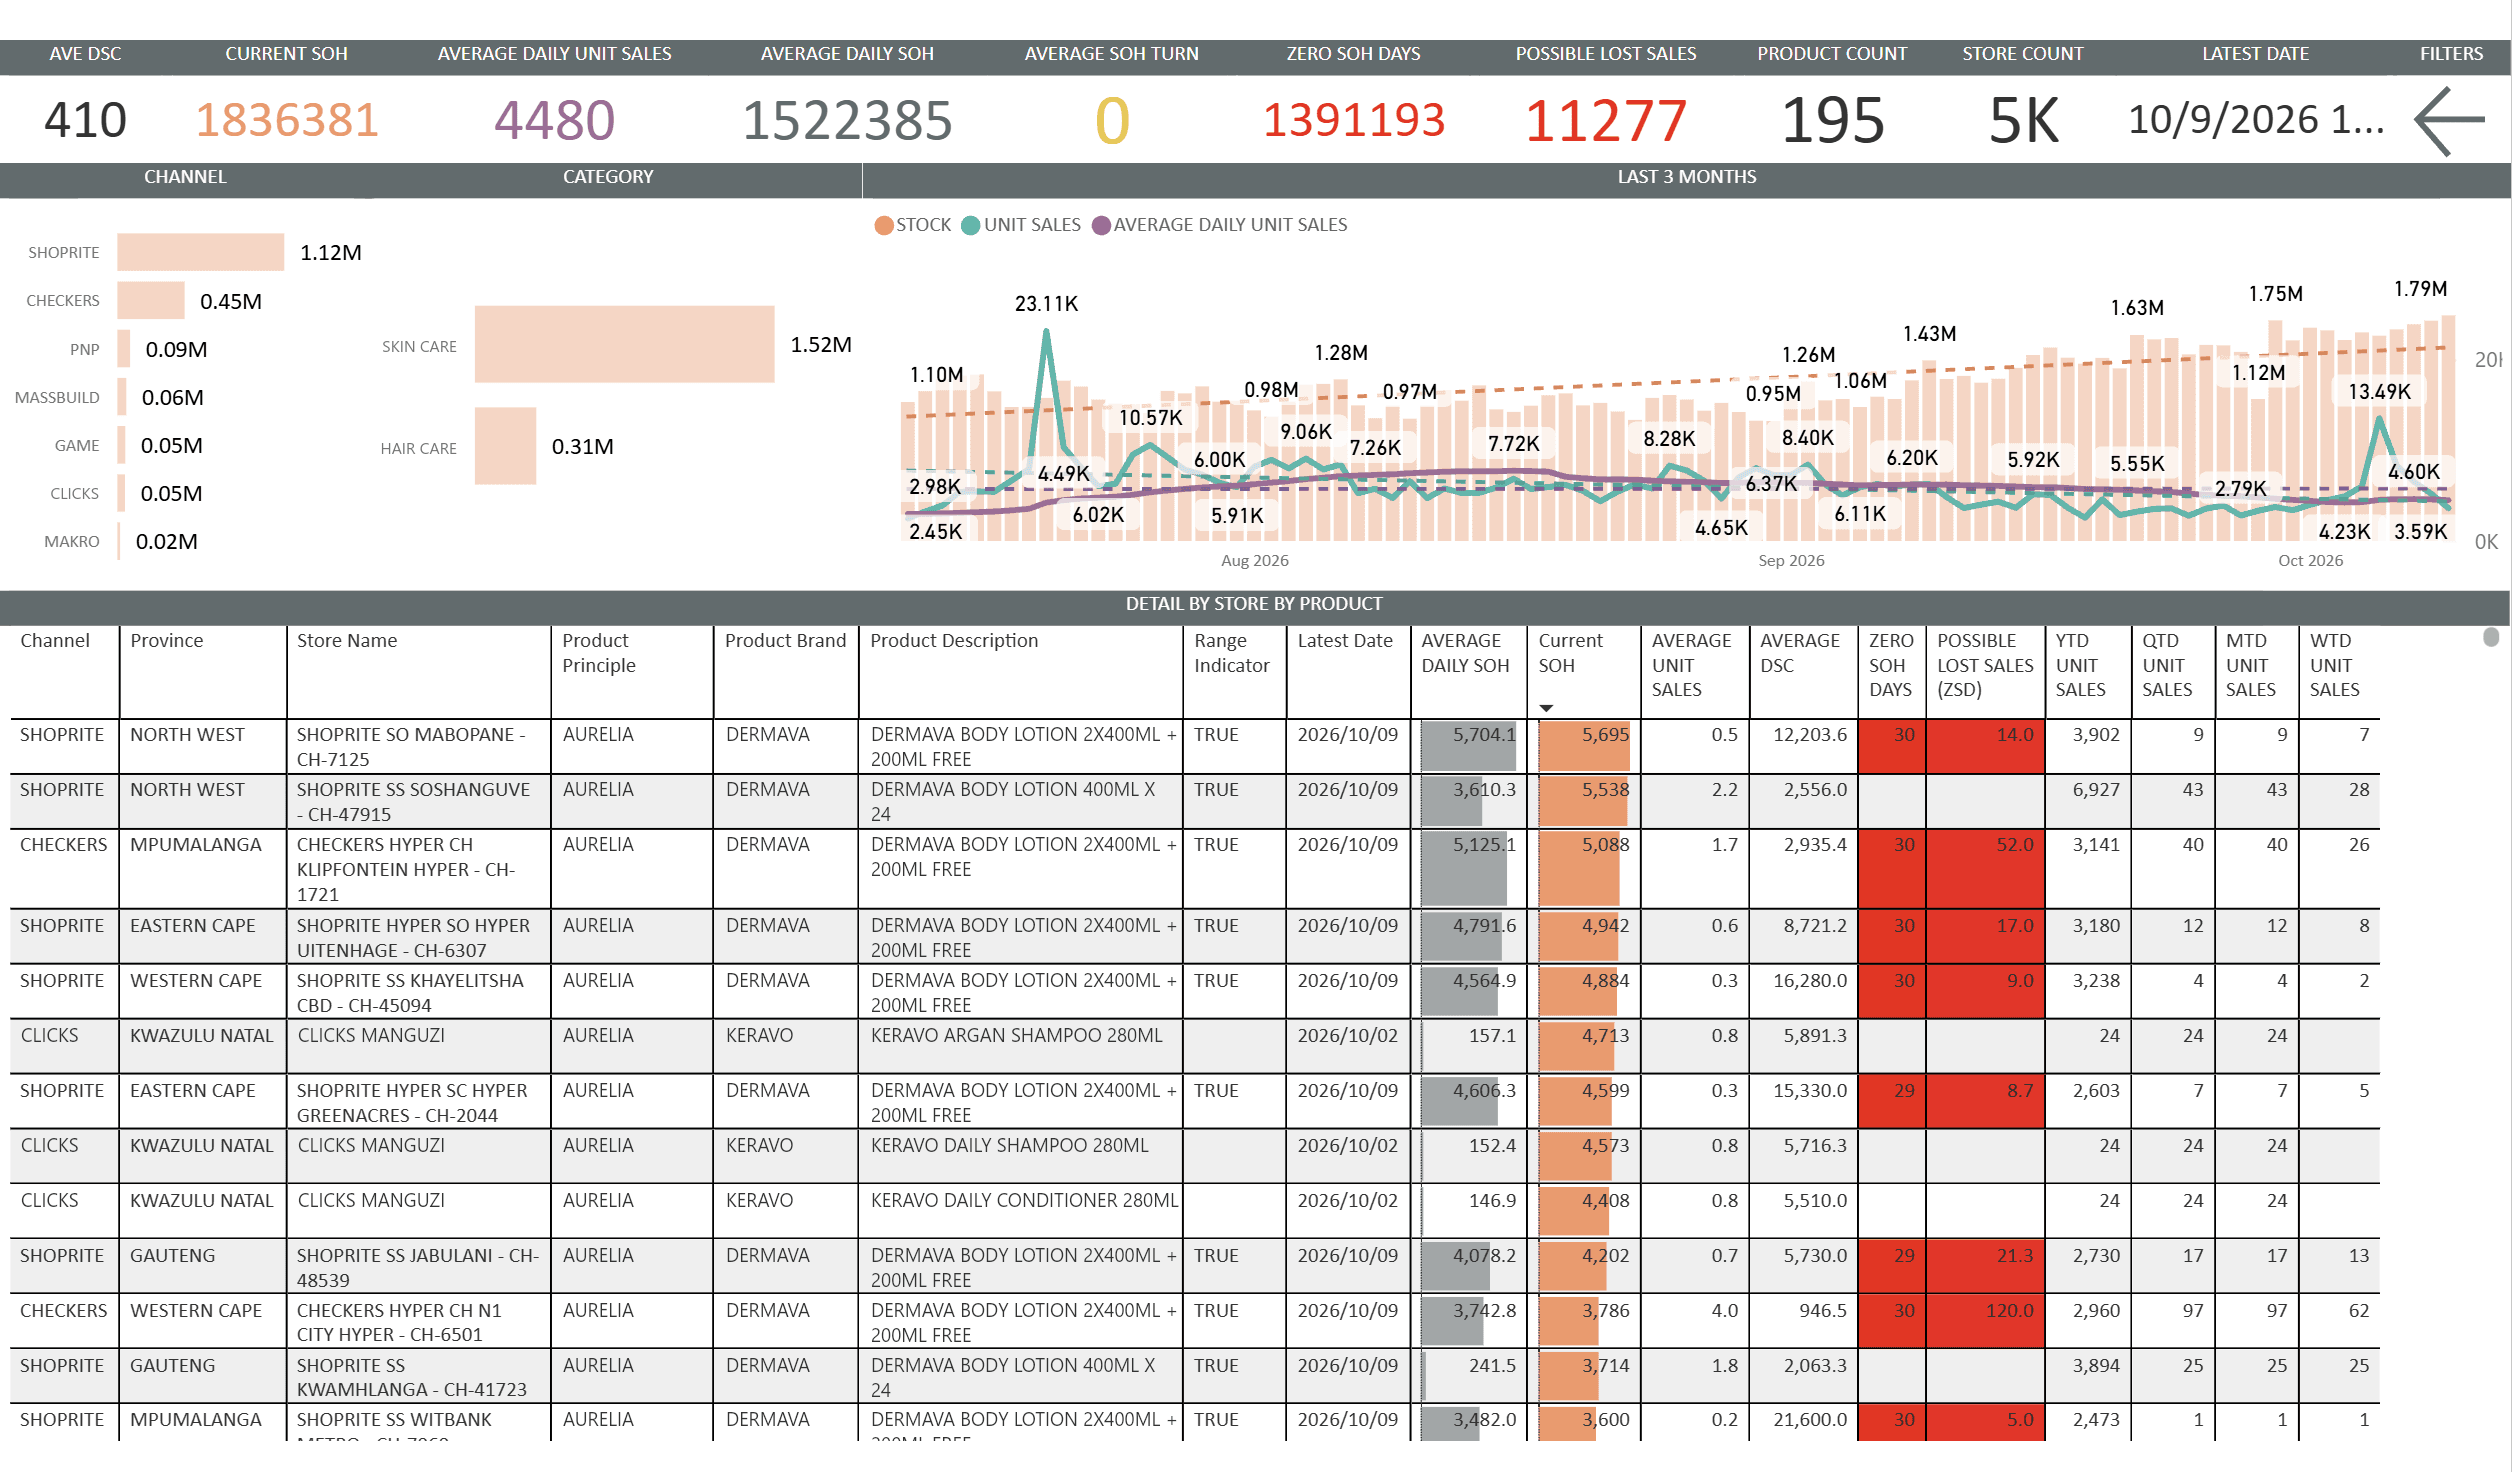
Stock on hand against sales for every store and product, with the gaps flagged in red so the field team knows where to go first. All filterable by SKU, store or channel.
Point at a number to see what it shows.
The questions it answers.
- Which products are growing, and which are quietly slipping?
- How are we doing this week, month, quarter and year against last year?
- Which provinces, channels and stores carry our numbers, and which do not?
- Did the promotion actually move volume, and where?
- Which stores are about to run out of our best sellers?
- Where are we sitting on stock that is not moving?
All retailers, one dataset. Every retailer in a single view, with codes matched to yours.
Period to date. Week, month, quarter and year to date, always against the same period last year.
Drill down. From national totals to province, channel, store and individual product.
Promotions in context. Your promo and channel calendars laid over the sales they were meant to drive.
Days of cover. Stock on hand measured against the current rate of sale, with out-of-stocks and low cover flagged.
Slow movers. Over-supply and ageing stock surfaced early, before it turns into returns.