Store reports
The right numbers for every store, in the right hands.
A focused report for each store: what sold, what is in stock, and what needs attention. Built for reps, merchandisers and key account managers, delivered as a link they can open on a phone.
Store reports are available for every retailer with physical stores. Every report shares the same core: out of stock, low cover, phantom stock and negative stock. Each one is then tailored to the way that retailer works: its statuses, its ordering rules and the data it shares. Two examples below.
Drive the order
The visit non-negotiables up top, then every line that needs action, ranked by the sales it is losing each day.
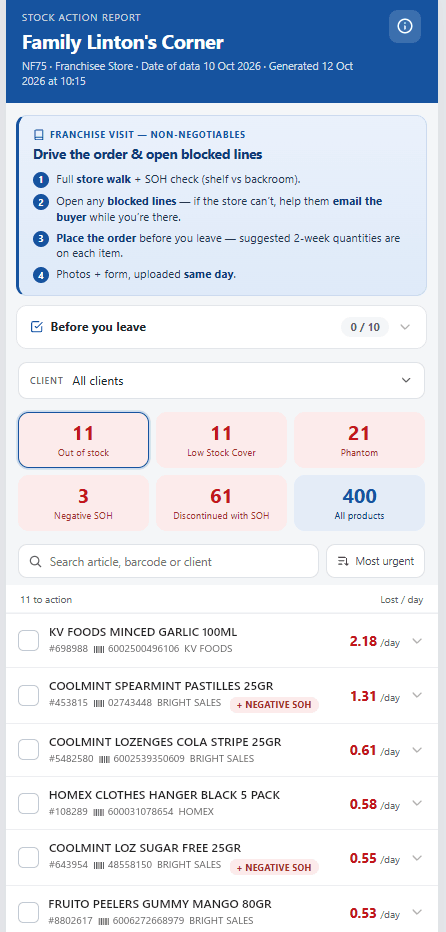
One store, one page: what to do on the visit, then what needs attention.
Point at a number to see what it shows.
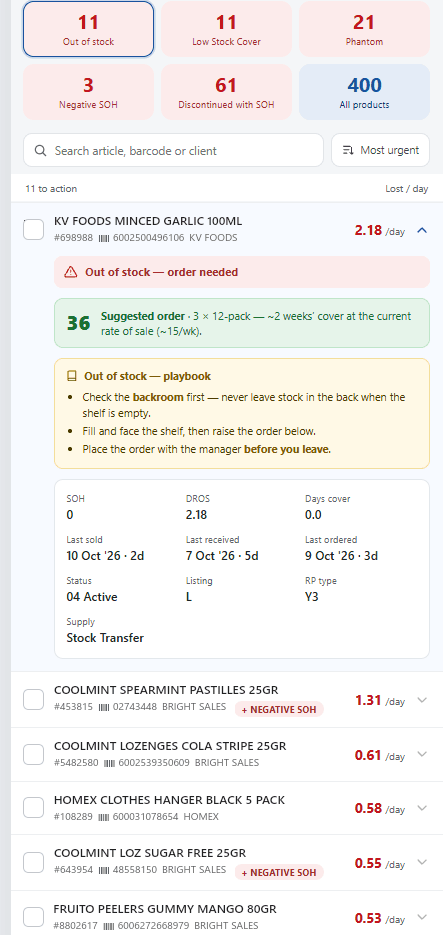
Every flagged line opens into the problem, the fix and the facts behind it.
Point at a number to see what it shows.
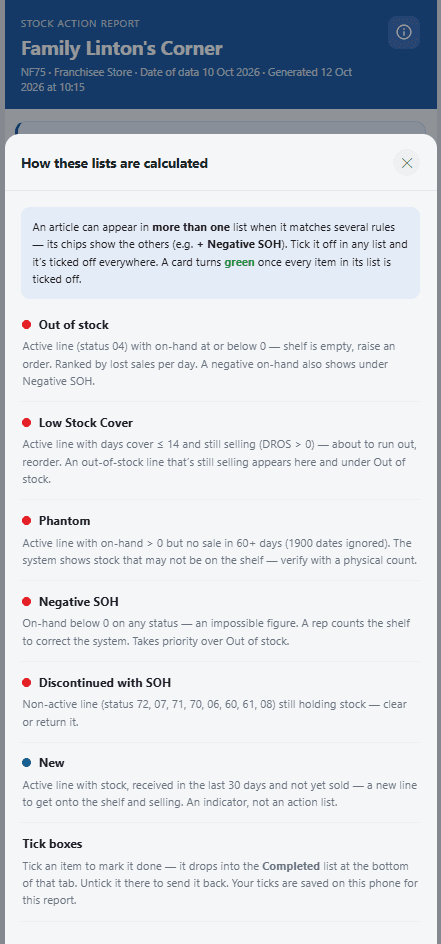
The rules in plain language, so the field team trusts what the report tells them.
Point at a number to see what it shows.
Protect the margin
The same stock lists, plus what this retailer's data makes possible: blocked and delisted lines, margin risk and margin opportunity, each with the rand value of fixing it.
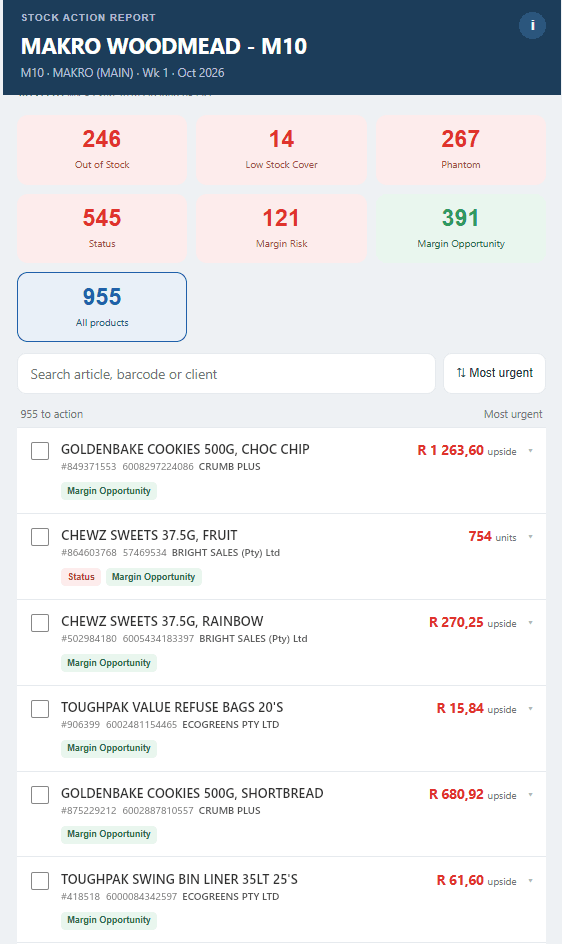
Stock problems and price problems on one list, ranked by their rand value.
Point at a number to see what it shows.
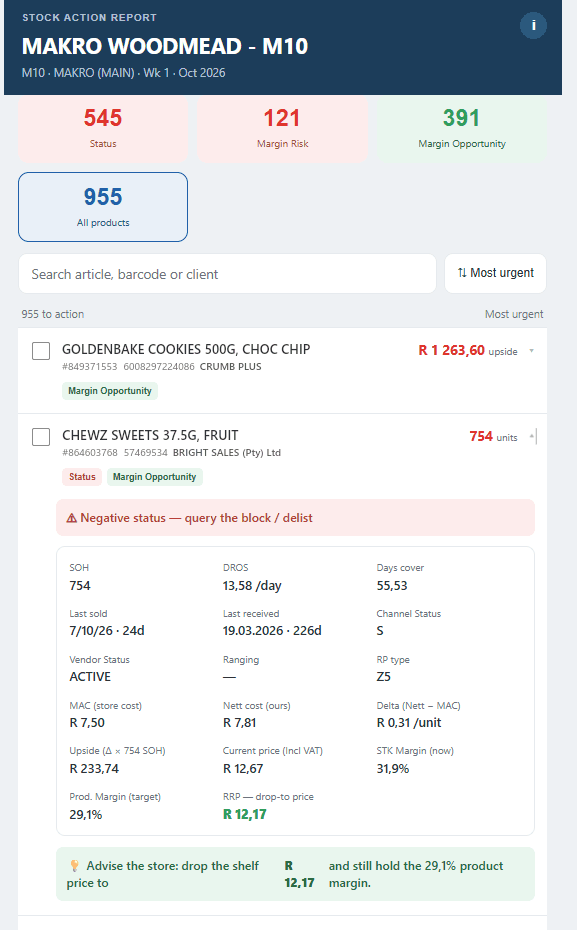
Open a line to see why it is flagged and what to tell the store.
Point at a number to see what it shows.
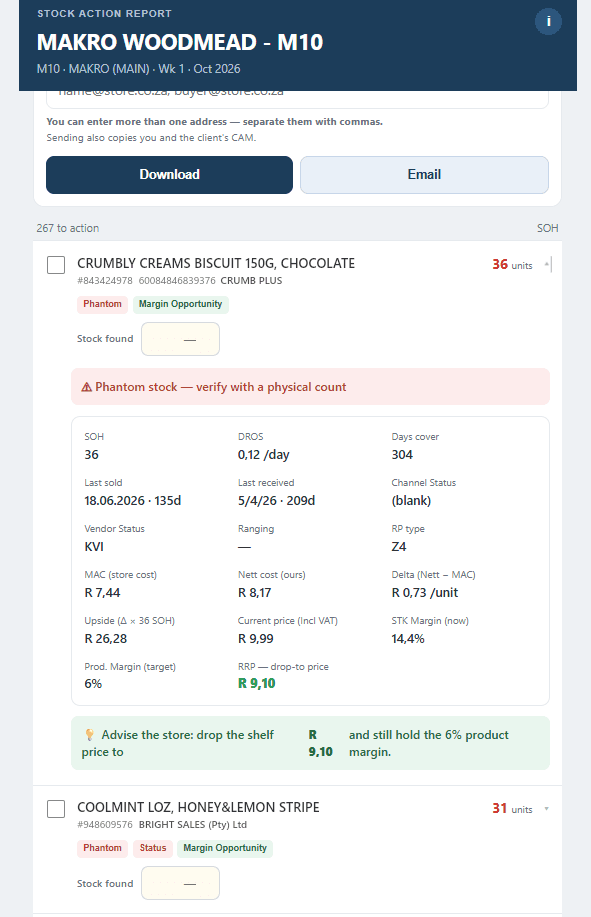
Phantom stock gets a physical count, and the report goes straight to the people who can act on it.
Point at a number to see what it shows.
Agencies and merchandising companies
Every client, one report per store.
Store reports can hold several suppliers' data in a single report, so merchandisers and reps do not have to jump between reports. Focus on what needs attention, per store, per client.
The questions it answers.
- What should my rep fix in this store on today's visit?
- How is this store doing against last year, and against its peers?
- Which lines are ranged but not selling here?
- What does the buyer need to see before the next meeting?
Store by store. Sell-out and stock for one store at a time, with nothing irrelevant in the way.
Red flags first. Out-of-stocks, slow movers and ranging gaps at the top of the page.
On the phone. A link that opens anywhere, no login to forget and no app to install.
One brand or many. A supplier sees its own products. An agency sees every client it handles, in one report.